Klaviyo's benchmark is 25–40% of revenue from email. Most stores hit 8–15%. Here's what the gap costs you, what's causing it, and how to fix it using 2026 data.

Most e-commerce store owners have no idea whether their email program is performing or just running.
They check Klaviyo, see a number, and move on. Maybe 10% of revenue is coming from email. Maybe 12%. It feels fine.
It is not fine.
The Klaviyo benchmark for a well-run e-commerce email program is 25 to 40% of total store revenue. Top-performing brands hit 50 to 60% during Q4. The average store is generating less than half that benchmark, often without realizing it.
On a store doing $500,000 per year, the gap between 12% and 35% email attribution is $115,000 in annual revenue sitting in your list, unearned.
This guide covers the benchmarks by email type, industry, and automation maturity. By the end, you will know exactly where your program stands, what is causing any gap, and what to fix first. We cover the same ground our team reviews when auditing Klaviyo accounts for e-commerce brands in Denver, Philadelphia, Kansas City, and across the US.
The Benchmark: What Percentage of Revenue Should Come from Email?
Start here. 25 to 40% of total e-commerce store revenue should come from email marketing. That is not an aspirational goal. That is the documented benchmark drawn from Klaviyo's data across hundreds of thousands of e-commerce accounts.
Understanding what your number actually means:
Under 15%: Your program has structural gaps. You are either missing core automation flows, sending to an unsegmented list, or dealing with deliverability damage that is cutting your inbox placement. This is not a content problem. It is a systems problem.
15 to 25%: You have the basics in place. Welcome email, abandoned cart sequence, some campaigns going out. But you are missing the advanced segmentation and flow infrastructure that pushes programs into the 30% range.
25 to 35%: Healthy. Your automation is working, your campaigns are consistent, and your list is reasonably segmented. There is room to grow, but you are not bleeding revenue.
35 to 45%: Strong performance. Your flows are optimized, your segments are tight, and you are likely running A/B tests on subject lines and content. You are in the top quartile of Klaviyo users.
45% and above: Best-in-class. This tier is earned through years of program maturity, proprietary segmentation models, and a rigorous testing culture.
One nuance: these benchmarks assume Klaviyo's standard attribution window of 5-day click and 1-day open. If your account uses a 7-day click window, your reported numbers will be higher. A tighter 1-day click window will show lower numbers. When you benchmark your program against industry data, confirm you are comparing with the same window settings.
The single most important action: go pull your number right now. Last 90 days. Email revenue divided by total store revenue. That percentage will anchor everything else in this guide.
Why Your Email Program Is Probably Leaving Money on the Table
If the benchmark is 25 to 40% and most stores are at 8 to 15%, something is clearly broken. But it is almost never one thing. It is three structural failures that compound on each other.
Structural failure 1: Missing automation flows.
Most stores set up a welcome email and an abandoned cart reminder, then stop. That is not a flow program. A complete retention email infrastructure includes welcome series, abandoned cart, browse abandonment, post-purchase nurture, win-back, and sunset sequences. Each captures revenue at a specific moment in the customer lifecycle.
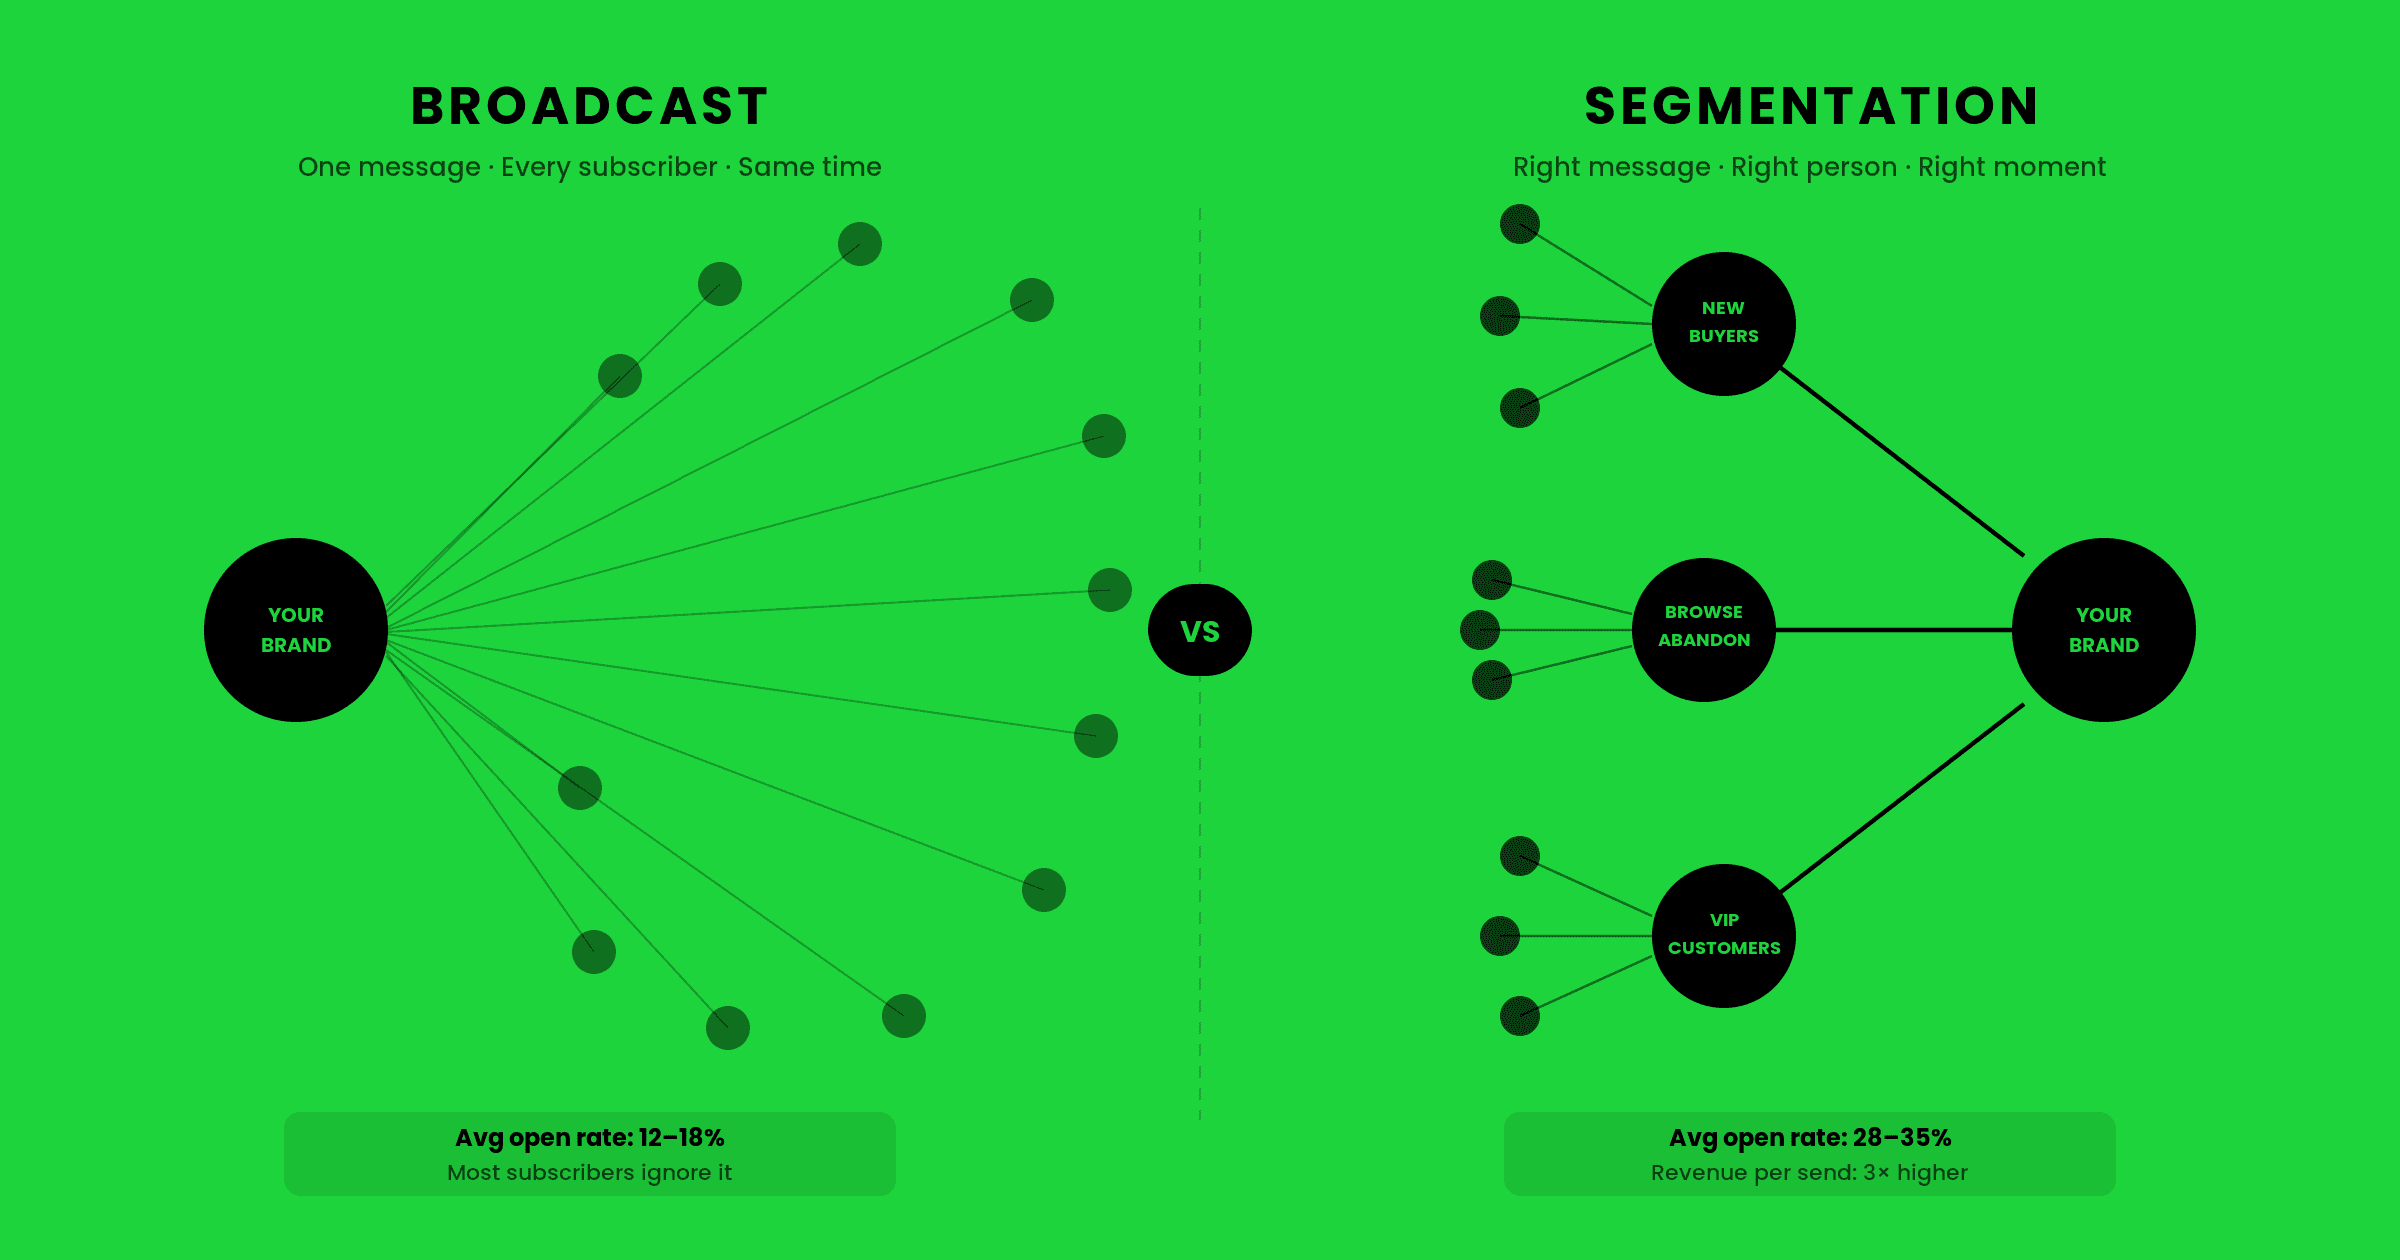
Klaviyo's benchmark data shows that flows generate 41% of total email revenue from just 5.3% of total sends. Revenue per recipient from automated flows runs nearly 18 times higher than from broadcast campaigns. If your flow coverage is thin, you are missing the most efficient revenue in your channel.
Structural failure 2: No list segmentation.
Sending one email to your entire list treats a loyal six-time buyer and a subscriber who has never opened an email as if they are identical. They are not. Klaviyo's research shows that segmented campaigns generate 760% more revenue than non-segmented sends. That is not a marginal improvement. That is a category-level difference.
The mechanism: relevance drives open rates, open rates drive click rates, and click rates drive revenue. When the email is irrelevant to the recipient, every conversion metric suffers.
Structural failure 3: Inconsistent sending cadence.
Email is a compounding channel. A store sending eight well-segmented campaigns per month builds trust, repeat purchase behavior, and sustained revenue attribution. A store sending one campaign per month to everyone is essentially running a monthly newsletter and wondering why it does not perform.
Brands generating 35% or more from email are typically sending 6 to 10 campaigns monthly, each to a specific, defined audience segment. High frequency to a tightly defined segment drives revenue. High frequency to an unsegmented list drives unsubscribes and deliverability damage. The frequency is not the variable. The segmentation is.
Flows vs. Campaigns: Where Email Revenue Actually Comes From
The most clarifying insight in email marketing is the revenue split between flows and campaigns. Most brands conflate them. The distinction determines how you prioritize everything.
Campaigns are one-time sends. You write a promotional email, schedule it, send it to your list or a segment. Black Friday sale. New product launch. Monthly newsletter.
Flows are automated sequences triggered by customer behavior. Someone signs up and your welcome series begins. Someone abandons a cart and your abandoned cart sequence fires. Someone buys and your post-purchase nurture starts. Flows run continuously without ongoing effort once built.
Here is what Klaviyo's benchmark data shows:
Metric | Campaigns | Flows |
|---|---|---|
Share of total sends | 94.7% | 5.3% |
Share of total email revenue | ~59% | ~41% |
Revenue per recipient (avg) | ~$0.11 | ~$1.98 |
Click rate | 1.69% | 5.58% |
Placed order rate | Baseline | 13x higher |
Flows generate their revenue from a tiny fraction of sends because timing and context are everything. An abandoned cart email landing 60 minutes after abandonment catches someone who was close to buying. A welcome email arriving within minutes of sign-up reaches someone at peak interest. Behavioral timing multiplies conversion in a way that broadcast scheduling cannot replicate.
The real numbers make this concrete. Abandoned cart flows average $3.65 revenue per recipient. Top 10% performers reach $28.89 per recipient on abandoned cart flows alone. Compare that to campaigns averaging $0.11 per recipient.
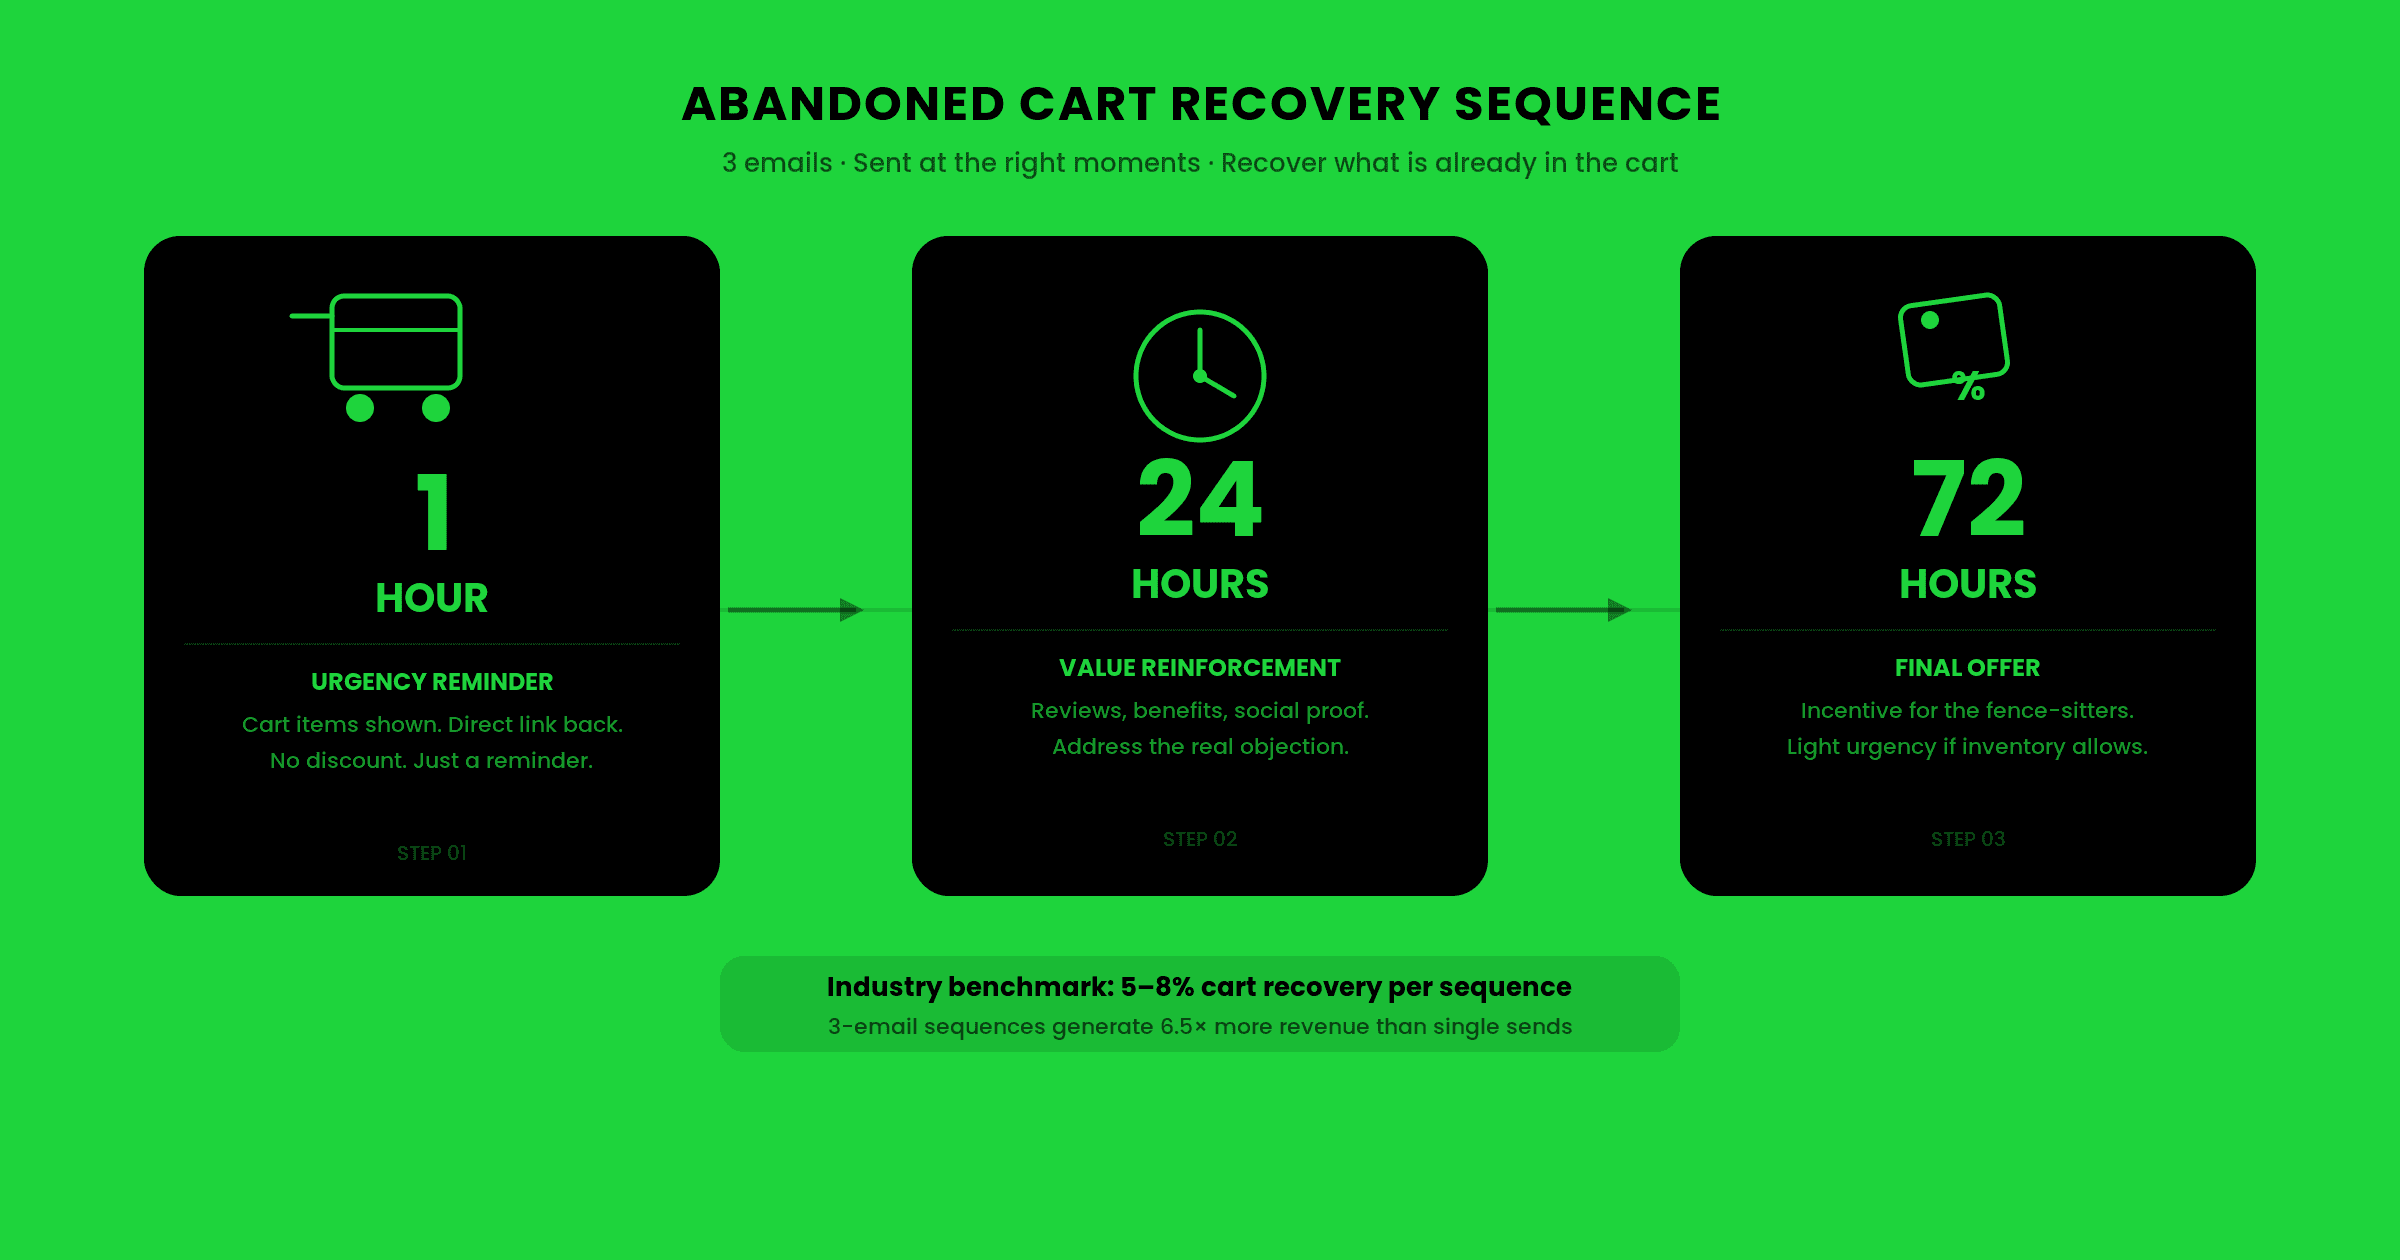
Sequence depth matters enormously. Three-email abandoned cart sequences generate on average $24.9 million in attributed revenue versus $3.8 million from single-email sequences, a 6.5x difference. The architecture of your sequences is as important as the quality of any individual email.
The practical implication: if more than 65% of your total email revenue is coming from campaigns rather than flows, your automation infrastructure is either missing or underperforming. That is where to start.
How to Calculate Your Email Revenue Attribution in 10 Minutes
You do not need to guess your number. Klaviyo surfaces it directly. Here is how to find it and what to do with it.
Step 1: Open Klaviyo and navigate to Analytics, then Overview.
The main dashboard shows total Klaviyo-attributed email revenue for the period selected. Change the date range to the last 90 days. A single month can be distorted by a one-time sale event. Ninety days gives you a reliable baseline.
Note this number.
Step 2: Pull your total store revenue for the same 90-day window.
Log into your Shopify, WooCommerce, or BigCommerce admin. Pull total gross revenue for exactly the same date range as your Klaviyo report.
Note this number.
Step 3: Calculate your email attribution percentage.
Formula: Email Revenue divided by Total Store Revenue, multiplied by 100.
Example: Store did $200,000 in the last 90 days. Klaviyo shows $20,000 in attributed email revenue. Attribution is 10%. Below benchmark.
Step 4: Break it down by flows versus campaigns.
In Klaviyo, navigate separately to Analytics, then Flows, and Analytics, then Campaigns. Calculate what share of your total email revenue is coming from each.
If flows are generating less than 40% of your email revenue, your automation infrastructure is the priority. If flows are healthy but your total attribution percentage is low, campaign frequency and segmentation are the gap.
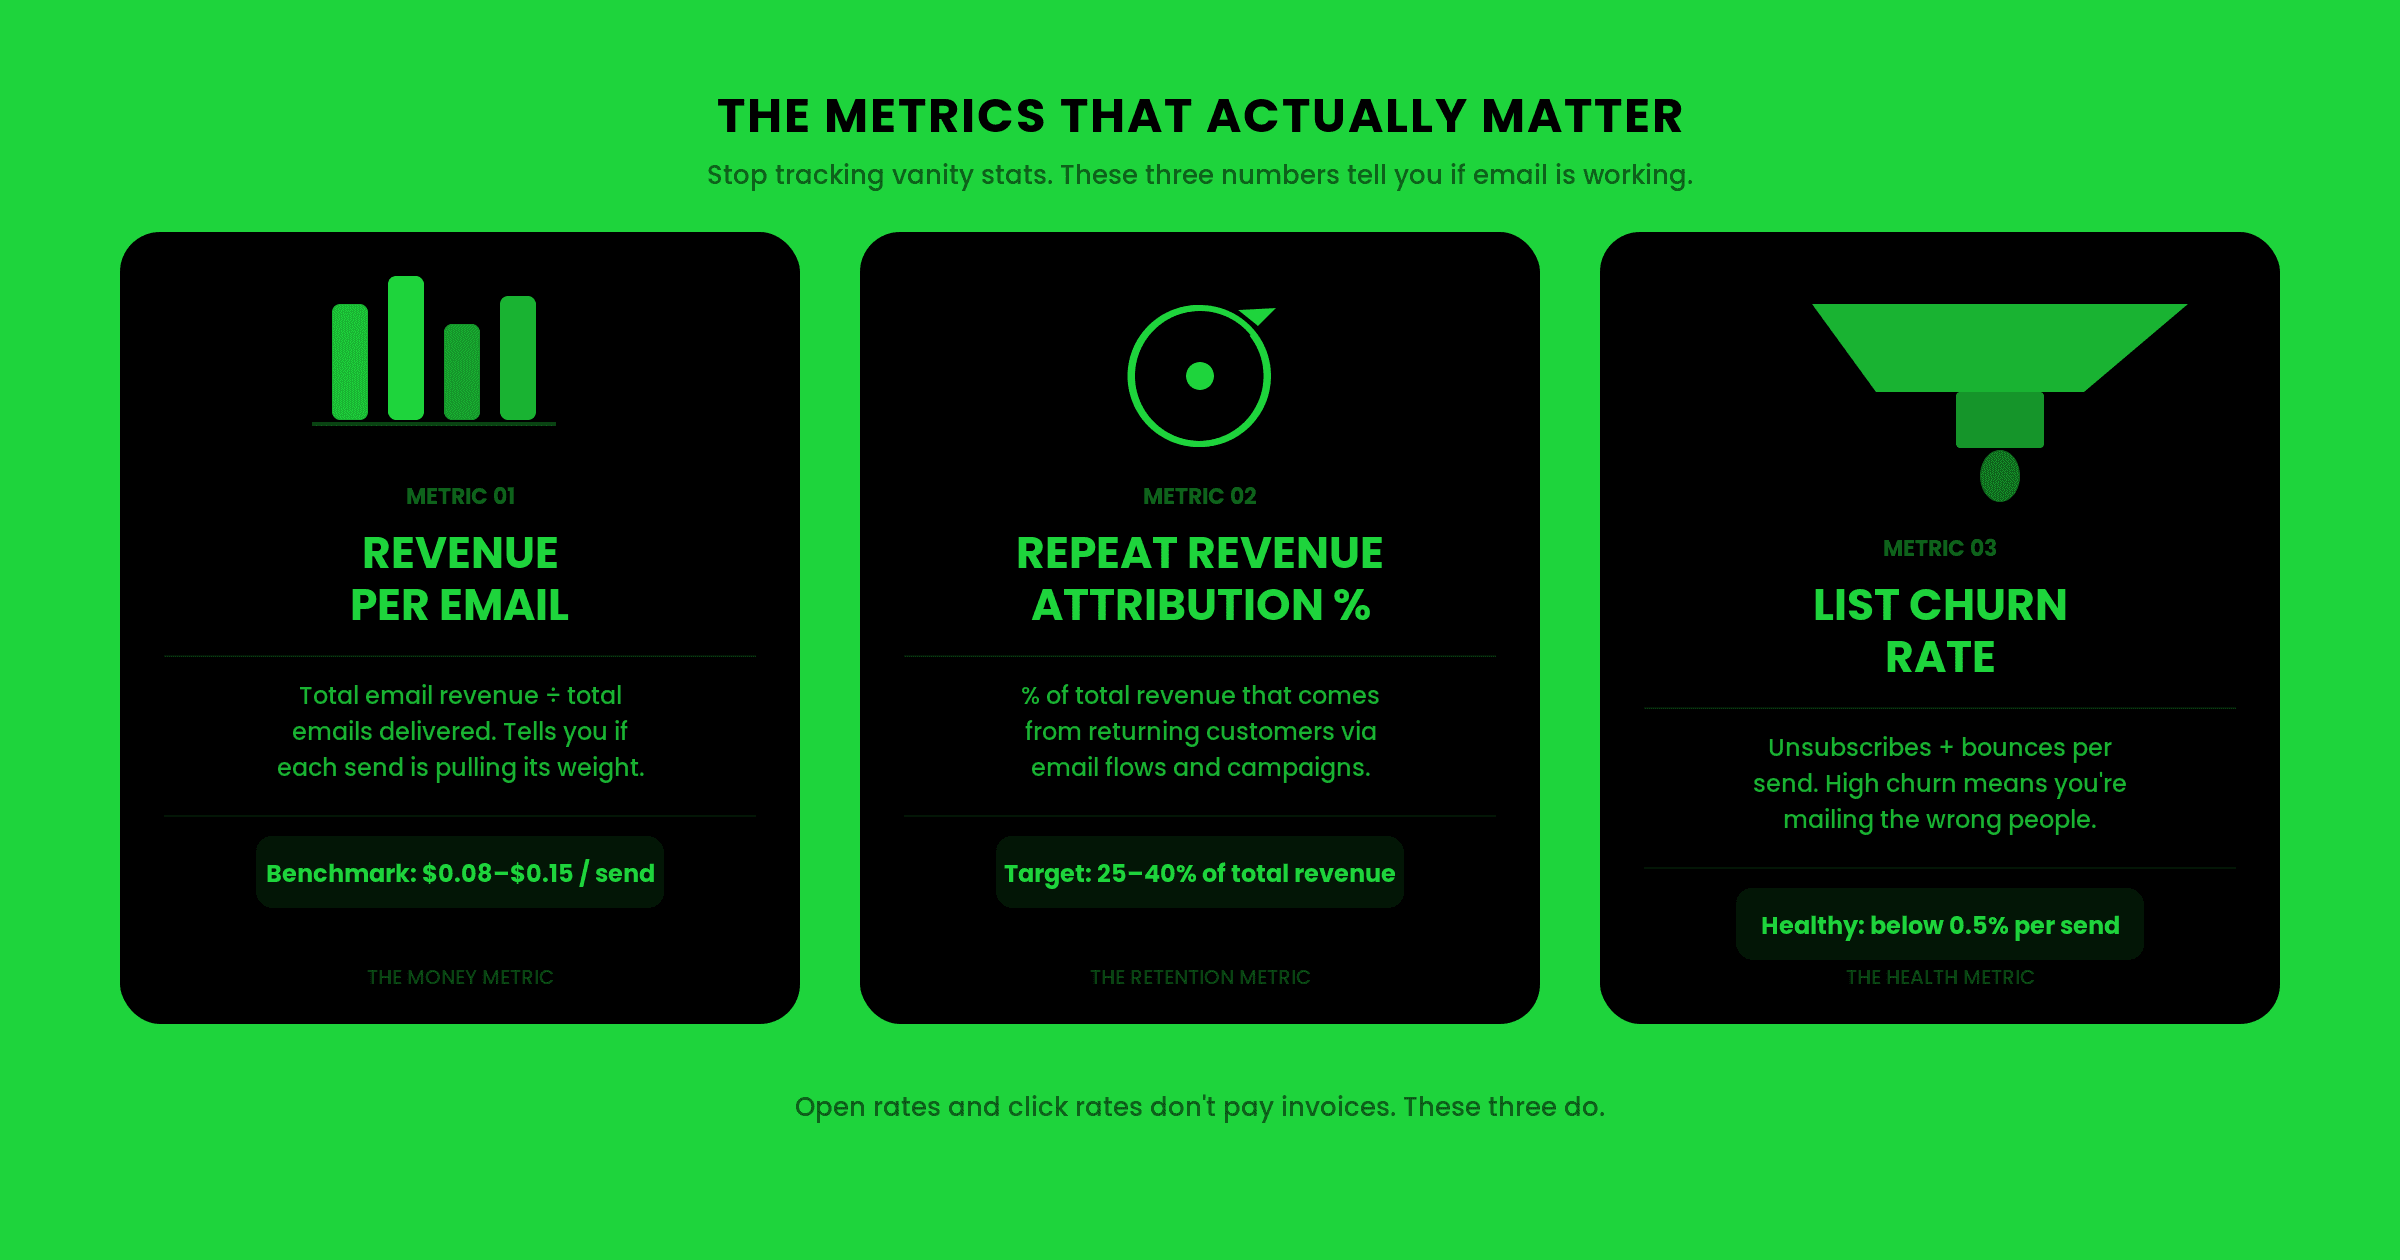
Step 5: Check your revenue per recipient (RPR) column.
In the Campaigns section, look at RPR rather than total revenue. A campaign sent to 10,000 people generating $800 has an RPR of $0.08, below average. A campaign to 1,200 tightly segmented repeat buyers generating $420 has an RPR of $0.35, which is strong.
Total revenue is a function of list size. RPR is a function of quality. Tracking RPR monthly shows whether your program is improving even when list size stays flat.
Email Revenue Benchmarks by Industry (2026 Data)
The 25 to 40% benchmark is a useful anchor, but different product categories have different purchase cycles, average order values, and customer relationships with email. Here is how attribution benchmarks break down by vertical, based on 2025 and 2026 Klaviyo data.
Apparel and Fashion
Apparel is one of the most email-receptive categories in e-commerce. Klaviyo data shows open rates averaging 40.6% for this vertical. Seasonal buying cycles, high new-product frequency, and strong visual storytelling all support email as the primary retention channel. Brands here should target 30 to 40% attribution.
The highest-performing apparel programs run separate campaigns for new arrivals (targeting engaged subscribers), sale access (targeting VIP purchasers first), and replenishment (targeting buyers of basics who reorder seasonally). This is not complicated segmentation. It is the difference between relevance and broadcast noise.
Health, Wellness, and Supplements
This vertical has a structural email advantage that most brands underuse: replenishment cycles. A customer who buys a 30-day protein powder supply will run out in 30 days. A replenishment email sent on day 24 captures predictable demand before the customer starts searching elsewhere.
Health and beauty averages a 2.49% placed order rate (top performing tier), and brands running replenishment flows routinely achieve 35 to 45% email attribution. The same brand without replenishment flows typically sits below 15%. That gap is almost entirely explained by one missing automation.
Food and Beverage
Food and beverage carries some of the highest add-to-cart rates in e-commerce, between 9.65% and 13.14%, well above the global average of 2 to 3%. High repeat purchase frequency is the driver. Coffee, hot sauce, and specialty consumables create natural monthly purchase cycles. Email is the channel that maintains and accelerates that behavior.
Post-purchase flows with consumption-pacing reminders (a "you're probably running low" email timed to average consumption rate) perform exceptionally well here. Brands with mature programs in this vertical regularly exceed 40% attribution.
Home and Garden
Lower purchase frequency makes email revenue attribution harder to build here. A customer buys furniture or garden tools and may not repurchase for 12 to 24 months. The email strategy shifts from repurchase to referral sequences, accessories upsells tied to the initial purchase, and seasonal reactivation.
Attribution benchmarks here typically land between 18 and 28%. The brands exceeding that are running deep catalogue cross-sell sequences and seasonal trigger campaigns tied to planting seasons, spring refresh cycles, and holiday gifting windows.
Beauty and Skincare
Daily-use products create a replenishment dynamic similar to supplements. Skincare customers also respond strongly to educational content. Programs built around routine construction ("your 5-step morning routine using what you just ordered") dramatically outperform purely transactional programs.
The educational email approach serves another purpose: it builds brand authority in a category where trust determines repurchase. Customers who understand why a product works are more loyal than customers who bought on promotion alone. Target attribution: 30 to 40%.
The 5 Flows Responsible for the Majority of Your Email Revenue
If flows generate 41% of email revenue from 5.3% of sends, the specific flows driving that performance matter more than any other tactical decision. Five automations account for the vast majority of flow revenue. If any are missing or underperforming, you have a measurable gap in your revenue infrastructure right now.
Welcome Series
The welcome flow activates when someone joins your list. This is the highest-intent window in the subscriber relationship. Klaviyo data shows welcome emails average a 51% open rate, with top-performing welcome flows achieving a 10% placed order rate and over $3.34 revenue per recipient for brands with $100 to $200 average order values. Welcome flows convert 5 times more subscribers than average email performance across all other sends.
Structure that performs: Email 1 delivers on the sign-up promise (discount code or brand introduction) within minutes of sign-up. Email 2 at 24 hours covers bestsellers and social proof. Email 3 at day 3 articulates your specific brand differentiation. Email 4 at day 5 or 7 closes with a soft urgency offer. The series should convert subscribers while they still remember why they signed up.
There is no other email in your program that reaches a subscriber at higher intent. Brands without a proper welcome series are abandoning their most reliable first-purchase conversion asset.
Abandoned Cart
On average, 70% of online shopping carts are abandoned before purchase. Klaviyo benchmarks show abandoned cart flows average a $3.65 revenue per recipient, a 3.33% placed order rate, and a 50.5% open rate. Top 10% performers reach a $28.89 RPR with 65.34% open rates.
The spread between average and top-10% performance is driven by two variables: timing (first email within 60 minutes outperforms 24-hour delays significantly) and sequence depth. A three-email sequence generates 6.5 times more revenue than a single-email sequence.
Structure: Email 1 within 60 minutes (simple reminder, product image, single CTA). Email 2 at 24 hours (social proof, reviews, address objections). Email 3 at 48 to 72 hours (incentive or scarcity, if brand-appropriate). Most brands run only one cart abandonment email. Moving to three is the highest-ROI automation change most e-commerce stores can make.
Browse Abandonment
Browse abandonment fires when a subscriber views a product page without adding to cart. Intent is lower than cart abandonment, but volume is dramatically higher because far more people browse than add to cart.
A two-email browse abandonment sequence at 24 and 72 hours, with product imagery and social proof, typically generates 3 to 6% of total email revenue with minimal ongoing maintenance. In Klaviyo, it requires one trigger condition and two emails. Brands that add it consistently report it as a strong contributor within 60 days of activation.
Post-Purchase Nurture
Most brands send an order confirmation and shipping notification, then go silent. The post-purchase window is when customer trust is highest. A complete post-purchase sequence includes order and shipping confirmation, product usage or education content delivered 2 to 3 days after shipping, a review request at 7 to 14 days after delivery, and a cross-sell recommendation based on their purchase category.
Brands running a full post-purchase sequence consistently report 20 to 30% higher 90-day repeat purchase rates compared to those who send transactional emails only.
Win-Back
Every email list accumulates dormant subscribers. At 90, 120, and 180 days of no opens, those subscribers are not just inactive, they are damaging your program. ISPs evaluate sender reputation based on engagement rates across your entire list. A large block of dormant subscribers will eventually depress inbox placement for your active subscribers too.
A three-email win-back sequence typically recovers 5 to 10% of dormant subscribers. The rest should be suppressed. List hygiene protects the deliverability of your entire program, not just the win-back audience.
Segmentation: The Lever That Multiplies Everything Else
You can have every flow running correctly and still underperform if your campaigns are broadcasting to an undifferentiated list. Segmentation is where the majority of email revenue gains are made for brands that already have basic flows active.
Klaviyo research shows segmented campaigns generate 760% more revenue than non-segmented sends. Segmented emails produce 30% more opens and 50% more click-throughs. Consumers who purchase through email spend 128% more than those who arrive through other channels. Behavioral trigger emails generate 10 times more revenue than generic broadcast sends.
These numbers are not theoretical. They reflect what happens when relevance improves at scale.
Purchase behavior segments
Divide your list into first-time buyers (one purchase), repeat buyers (2 to 3 purchases), loyal customers (4 or more purchases), and churned buyers (purchased but not in 90-plus days). These cohorts respond to completely different messaging.
First-time buyers need reinforcement that they made the right decision and a clear reason to return. Send educational content about the product they bought, a review request, and a relevant cross-sell. Repeat buyers have demonstrated preference. Give them early access to new products before the general list. Loyal customers respond to exclusivity, not standard discounts. Give them VIP status, first access, and the feeling that the brand sees and values them. Churned buyers need a compelling reintroduction with something genuinely new, not the same email they ignored last month.
Engagement-based segments
Separate active subscribers (opened in the last 30 days), engaged subscribers (opened in the last 90 days), lapsing subscribers (no opens in 90 to 120 days), and dormant subscribers (no opens in 120-plus days).
Active and engaged subscribers should receive your full campaign cadence. Lapsing subscribers should receive a re-engagement focused campaign before they go fully dormant. Dormant subscribers should receive only your win-back sequence and nothing else. Sending promotional campaigns to your dormant segment directly damages your deliverability by suppressing aggregate engagement rates across your sender domain.
Predicted behavior from Klaviyo AI
Klaviyo's predictive analytics assign each profile a predicted next order date, churn risk score, and predicted customer lifetime value. Using these predictions to time campaigns places emails when the customer is statistically most likely to buy. This moves beyond reactive behavioral history into forward-looking optimization.
For brands new to segmentation, start with two segments: active versus dormant, and first-time versus repeat buyers. These two divisions alone produce measurable revenue improvements within a single quarter.
How to Read Your Klaviyo Dashboard for Revenue Gaps
Klaviyo surfaces more diagnostic data than most store owners ever use. A 10-minute monthly dashboard review, done systematically, tells you more about program health than almost any other activity.
Overview screen: Set your date range to the last 90 days. Note total attributed email revenue. Divide by total store revenue for the same period. This is your attribution percentage and your primary program health metric.
Flows section (Analytics, then Flows): This view breaks down revenue by individual flow. Check which flows are generating revenue and which show nothing or near-nothing. A zero on your welcome series means it is misconfigured or the trigger is broken. Then look at the RPR column for each flow. A browse abandonment flow with a $0.09 RPR has a content or timing problem. A win-back flow with a $0.22 RPR and a 3% conversion rate is performing well for its purpose.
Campaigns section (Analytics, then Campaigns): Look at revenue per recipient, not total revenue. A campaign to 8,000 people generating $600 has an RPR of $0.075, below average. A campaign to 1,200 tightly segmented repeat buyers generating $420 has an RPR of $0.35, which is strong. Total revenue is a function of list size. RPR is a function of quality.
Segments section: Check the size of your active subscriber segment (opened in the last 30 days) as a percentage of your total list. If active subscribers are below 20% of your total list, you have deliverability risk. ISPs will begin routing a higher percentage of your sends to spam folders regardless of content quality.
Attribution window: Confirm your window in Klaviyo account settings. The standard is 5-day click plus 1-day open. A 7-day click window inflates reported revenue and can make a mediocre program look healthy when comparing to standard benchmarks.
Seven Signs Your Email Program Is Leaking Revenue Right Now
You do not always need a full audit to know something is structurally wrong. These seven signals point to specific problems and where they live.
Signal 1: Email attribution below 20% after 6 months of sending.
If you have been running email for more than 6 months and attribution is still under 20%, you have a structural gap, not a content gap. Check which of the 5 core flows are live in your Klaviyo account. If 2 or more are missing, start there.
Signal 2: Flow revenue below 35% of total email revenue.
Strong programs generate 40 to 60% of email revenue from flows. Below 35% means key flows are missing, misconfigured, or failing to reach enough of your subscriber base. This is the most reliable indicator of incomplete automation infrastructure.
Signal 3: Fewer than 5 campaigns per month.
One campaign per month is not an email program. Brands generating 30% or more from email are typically sending 6 to 10 campaigns monthly across segmented audiences. Below 5 is usually a capacity problem, not a strategy problem.
Signal 4: Open rate declining for 3 consecutive months.
A sustained open rate decline is a deliverability signal before it is a content signal. Check Google Postmaster Tools for your sending domain. Check whether you are sending to dormant subscribers at scale. Each cause has a different fix, but all require action before the next send cycle.
Signal 5: Unsubscribe rate consistently above 0.35% per send.
The 2025 industry average unsubscribe rate is 0.22%. Rates above 0.35% indicate a content-audience mismatch. You are sending the wrong message to the wrong people. Brands that track and respond proactively to unsubscribe trends report 16% higher annual email revenue because they identify and correct problems faster.
Signal 6: No list hygiene in the last 12 months.
Only 23.6% of marketers verify and clean their lists before campaigns. A list growing for a year without removing dormant subscribers is building deliverability debt. Inbox placement in North America averages 87.9% for healthy senders. Brands with neglected hygiene fall well below this, often without realizing it until open rates drop and stay down.
Signal 7: You do not know your revenue per recipient.
RPR is the most important metric in email marketing and the least-tracked by the brands that need it most. If you cannot state your current campaign RPR and flow RPR for the last 90 days, you are operating without the primary diagnostic number for your highest-ROI channel.
When to Fix It Yourself vs. Work With a Klaviyo Email Agency
Email marketing is learnable. The flows described in this guide are not technically complex to build. Klaviyo's documentation is comprehensive. So when does outside expertise add more value than the investment?
Fix it yourself when:
You are at an early stage, under $200,000 in annual revenue, and learning the platform is a reasonable use of your time. The investment is 2 to 3 months of focused learning and setup. Get the five core flows live, get basic segments running, and establish a consistent 4 to 6 campaign-per-month cadence. Once email is generating meaningful revenue, reassess the decision with actual performance data.
You have a capable in-house operator who can dedicate 8 to 12 hours per week to email. A focused operator with good documentation and a structured learning approach can build a solid foundation within 3 months.
Work with a specialist when:
You have been running email for 6 or more months and attribution is still below 20%. This is the clearest signal that the DIY path has hit a ceiling. Someone who has diagnosed the same problem across dozens of Klaviyo accounts will identify it far faster than iterating alone.
You are scaling fast and email is your highest-ROI channel. On a store doing $1 million per year at 12% email attribution, the gap to the 30% benchmark represents $180,000 in uncaptured annual revenue. At that scale, professional email management pays for itself in the first few months.
You do not want to manage it yourself. Retention email done properly requires consistent execution across flow optimization, campaign strategy, A/B testing, list hygiene, and deliverability monitoring. If this is not where your operational attention should be, delegation is the right call.
Mailing Monk works with e-commerce brands across the US, including teams serving brands in San Diego and Kansas City. The question is simple: is the gap between where you are and the 25 to 40% benchmark worth the cost of closing it faster?
For most stores above $300,000 in annual revenue sitting under 20% email attribution, the answer is yes.
Where Does That Leave You?
Email marketing should generate 25 to 40% of your e-commerce revenue. It should be split roughly 40 to 60% from flows and the rest from campaigns. And the gap between where you are and that benchmark almost always traces back to three things: missing flows, an unsegmented list, or inconsistent sending cadence.
The fastest diagnostic: pull your 90-day email attribution right now. Check which of the five core flows are live in your Klaviyo account. Look at the RPR column for your last five campaigns. Those three data points will tell you exactly where the leak is and what to fix first.
If your program is generating under 20% and you have been at it for more than six months, it is worth getting a second set of eyes on it.
Book a free Klaviyo audit with Mailing Monk
We review your flows, segments, campaign performance, and deliverability. Then we tell you exactly what to fix, whether you want us to handle it or do it yourself.
Published by Mailing Monk. Klaviyo email marketing for e-commerce brands.

Our mission is simple: help brands grow through better emails. We focus on strategy, design, and data to turn the inbox into a high-performing sales channel; without the noise. We believe great email marketing is clear, personal, and built to last.